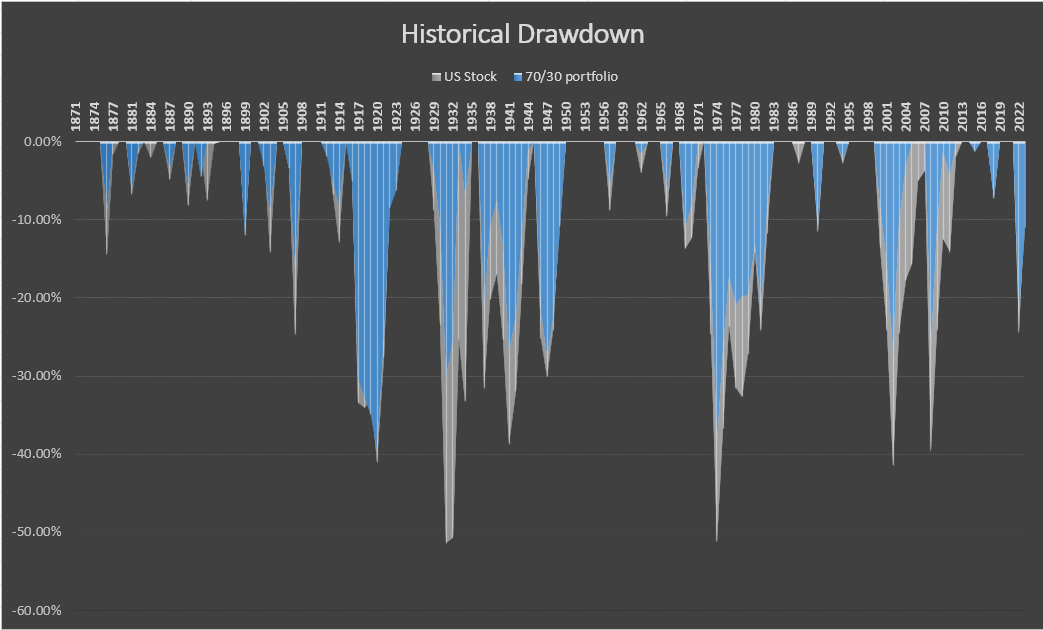
Another graph based on my historical data table. It tracks the drawdowns for for a portfolio of 70% stocks, 30% of which are International, and 30% bonds. I takes care of showing the effect of both 2022 when both stocks and bonds went down.
There are times where returns are not so dampened by bonds, so the Required Flexibility may need to be a little higher (lower income) than calculated by the tool for bond-heavy AAs.
This is the "inflation adjusted" flavor of the chart, similar to the bottom chart in my previous post.
![Image]()
Maybe I shouldn't have included international returns in this chart, not sure how much impact they have, the tables I use don't have international data before 1972, so they use US data instead for those years.
There are times where returns are not so dampened by bonds, so the Required Flexibility may need to be a little higher (lower income) than calculated by the tool for bond-heavy AAs.
This is the "inflation adjusted" flavor of the chart, similar to the bottom chart in my previous post.
Maybe I shouldn't have included international returns in this chart, not sure how much impact they have, the tables I use don't have international data before 1972, so they use US data instead for those years.
Statistics: Posted by Raspberry-503 — Sun Sep 15, 2024 1:39 am — Replies 2389 — Views 660163