For those interested in reading how the calculations have been done…
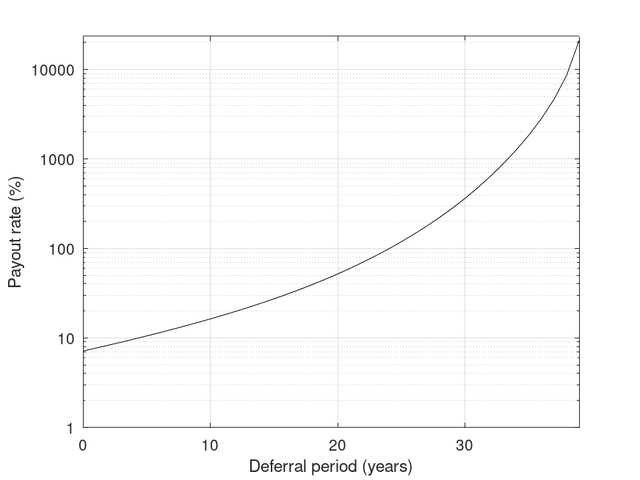
Annuity payout rates
Female mortality statistics have been drawn from https://mort.soa.org/ViewTable.aspx?&TableIdentity=2586 (I note that these are from 2012 without later improvements and are period not cohort values). From these values, the percentage of 65 year old females (in the example used in the first post) surviving to a range of ages can be calculated (I’ve arbitrarily capped the calculations at 104 – going to greater ages will not make that much difference to the outcomes).
Following the method given by Pfau (see https://retirementresearcher.com/securi ... annuities/), the annuity payout rate with various deferral periods can be calculated. Given that it is not possible to know the internal rates of returns (or the actual life tables) used by the insurance companies, I have used a discount rate of 5% since this results in a payout rate of 7.1% when taken immediately at 65 which is consistent with the mean payout rate indicated at https://www.immediateannuities.com/comp ... y-reports/ for May 2024 (it also tallies with the yield on AAA corporate bonds given in that link).
The nominal payout rate (i.e., annual income/premium, expressed as a percentage) for various deferral periods is given in the following figure (note the logarithmic y-axis)
![Image]()
Yes, it really is the case that if our example 65 year old female deferred to aged 104 they would get a payout rate of over 20000% of premium. However, only 3% of 65 year old females will live to 104 and about 35% of those will die by 105. (so only receive one years worth of payments). In reality, I doubt that there are any insurance companies that will allow such a long deferral period (or are there?) or many retirees willing to take that bet.
Initial annuity income
To calculate the amount of the initial portfolio used to purchase the annuity, I’ve assumed that an income of 4% of the initial portfolio value is required during the deferral period and that this will be provided by a TIPS ladder (using a real yield to maturity of 2.1%) and that all of the remaining part of the portfolio after constructing the ladder will be used to purchase the annuity. For example, with a 20 year deferral, the TIPS ladder would have a payout rate of pmt(2.1%,20,-100,0,1)=6.0%. This means that about 67% of the portfolio is needed to construct the ladder, while the remaining 33% is available to purchase the deferred annuity. For a 20 year deferral, the payout rate is 51.8% of premium, so the nominal initial payout rate is roughly 17.5% (i.e., 0.33*51.8) of the initial portfolio (so for a $1m portfolio, a $330k premium would buy $175k nominal annual income in 20 years time). I note that with 2.1% yield, the maximum length ladder that would support a payout of 4% is 34 years (of course, TIPS are limited to 30 years, but it is possible to build a longer ladder, but one subject to interest rate and reinvestment risk) hence presenting a limit to the deferral period (this also explains the fall in real initial income in the graph in the previous post since there isn’t enough of the portfolio left after constructing the ladder to purchase an annuity that will give sufficient income).
However, inflation will reduce the purchasing power of the initial annuity payout. Continuing with the example of a 20 year deferral from the last paragraph, if annualised inflation was 3% between purchase and deferral, the real value of the annuity purchase would be 17.5/power(1.03,20)=9.7% of the initial portfolio value. It is this value that was plotted as a function of deferral period and inflation in the graph in previous post.
Further thoughts
We now have enough information to explain the shape of the curves in the graph in the first post. There are four factors influencing the initial real income from the annuity, namely the yield (discount rate), inflation rate, the nominal payout rate, and the amount left over to purchase the annuity after constructing the TIPS ladder. While real growth of the premium during deferral is determined by the difference between the yield and inflation, the nominal payout rate increases with deferral period and the amount available to purchase the annuity decreases with deferral period, but these change at different rates with the purchase amount decreasing more rapidly for short deferrals and the payout rate increasing more rapidly at longer deferrals. It is these offsetting factors that result in the peak at long deferrals for the curves where inflation does not dominate the outcomes.
A last few additional thoughts:
1) A male annuitant would do slightly better on payout rates (but has less chance of survival) and joint annuitants somewhat worse.
2) Income during the deferral period could be provided by a stock/bond portfolio instead of a TIPS ladder but runs the risk of portfolio exhaustion if a SWR approach is adopted. A combination of both ladder and a variable withdrawal approach from the portfolio would ensure portfolio survival beyond the end of the deferral period and allow upside in good retirements.
3) In the example, while all of the residual portfolio after the construction of the TIPS ladder has been used in the annuity purchase, alternatively a fraction could be used with the remaining part being left invested.
4) Like with all nominal annuities (and nominal bonds for that matter), inflation presents a significant risk. The inflation over the period of deferral and then when the annuity is in payment, is critical to how well a DIA provides longevity insurance.
Cheers
StillGoing
Annuity payout rates
Female mortality statistics have been drawn from https://mort.soa.org/ViewTable.aspx?&TableIdentity=2586 (I note that these are from 2012 without later improvements and are period not cohort values). From these values, the percentage of 65 year old females (in the example used in the first post) surviving to a range of ages can be calculated (I’ve arbitrarily capped the calculations at 104 – going to greater ages will not make that much difference to the outcomes).
Following the method given by Pfau (see https://retirementresearcher.com/securi ... annuities/), the annuity payout rate with various deferral periods can be calculated. Given that it is not possible to know the internal rates of returns (or the actual life tables) used by the insurance companies, I have used a discount rate of 5% since this results in a payout rate of 7.1% when taken immediately at 65 which is consistent with the mean payout rate indicated at https://www.immediateannuities.com/comp ... y-reports/ for May 2024 (it also tallies with the yield on AAA corporate bonds given in that link).
The nominal payout rate (i.e., annual income/premium, expressed as a percentage) for various deferral periods is given in the following figure (note the logarithmic y-axis)
Yes, it really is the case that if our example 65 year old female deferred to aged 104 they would get a payout rate of over 20000% of premium. However, only 3% of 65 year old females will live to 104 and about 35% of those will die by 105. (so only receive one years worth of payments). In reality, I doubt that there are any insurance companies that will allow such a long deferral period (or are there?) or many retirees willing to take that bet.
Initial annuity income
To calculate the amount of the initial portfolio used to purchase the annuity, I’ve assumed that an income of 4% of the initial portfolio value is required during the deferral period and that this will be provided by a TIPS ladder (using a real yield to maturity of 2.1%) and that all of the remaining part of the portfolio after constructing the ladder will be used to purchase the annuity. For example, with a 20 year deferral, the TIPS ladder would have a payout rate of pmt(2.1%,20,-100,0,1)=6.0%. This means that about 67% of the portfolio is needed to construct the ladder, while the remaining 33% is available to purchase the deferred annuity. For a 20 year deferral, the payout rate is 51.8% of premium, so the nominal initial payout rate is roughly 17.5% (i.e., 0.33*51.8) of the initial portfolio (so for a $1m portfolio, a $330k premium would buy $175k nominal annual income in 20 years time). I note that with 2.1% yield, the maximum length ladder that would support a payout of 4% is 34 years (of course, TIPS are limited to 30 years, but it is possible to build a longer ladder, but one subject to interest rate and reinvestment risk) hence presenting a limit to the deferral period (this also explains the fall in real initial income in the graph in the previous post since there isn’t enough of the portfolio left after constructing the ladder to purchase an annuity that will give sufficient income).
However, inflation will reduce the purchasing power of the initial annuity payout. Continuing with the example of a 20 year deferral from the last paragraph, if annualised inflation was 3% between purchase and deferral, the real value of the annuity purchase would be 17.5/power(1.03,20)=9.7% of the initial portfolio value. It is this value that was plotted as a function of deferral period and inflation in the graph in previous post.
Further thoughts
We now have enough information to explain the shape of the curves in the graph in the first post. There are four factors influencing the initial real income from the annuity, namely the yield (discount rate), inflation rate, the nominal payout rate, and the amount left over to purchase the annuity after constructing the TIPS ladder. While real growth of the premium during deferral is determined by the difference between the yield and inflation, the nominal payout rate increases with deferral period and the amount available to purchase the annuity decreases with deferral period, but these change at different rates with the purchase amount decreasing more rapidly for short deferrals and the payout rate increasing more rapidly at longer deferrals. It is these offsetting factors that result in the peak at long deferrals for the curves where inflation does not dominate the outcomes.
A last few additional thoughts:
1) A male annuitant would do slightly better on payout rates (but has less chance of survival) and joint annuitants somewhat worse.
2) Income during the deferral period could be provided by a stock/bond portfolio instead of a TIPS ladder but runs the risk of portfolio exhaustion if a SWR approach is adopted. A combination of both ladder and a variable withdrawal approach from the portfolio would ensure portfolio survival beyond the end of the deferral period and allow upside in good retirements.
3) In the example, while all of the residual portfolio after the construction of the TIPS ladder has been used in the annuity purchase, alternatively a fraction could be used with the remaining part being left invested.
4) Like with all nominal annuities (and nominal bonds for that matter), inflation presents a significant risk. The inflation over the period of deferral and then when the annuity is in payment, is critical to how well a DIA provides longevity insurance.
Cheers
StillGoing
Statistics: Posted by StillGoing — Wed Jun 05, 2024 3:35 am — Replies 1 — Views 91